in this article
- What leadership wants to know
- Metrics by video goal
- Where to find each number
- Training, e-learning, and onboarding: completion, rating, and hours saved
- Sales and case studies: connecting the video to the CRM
- Brand and events: qualified reach and shelf life
- When nobody measured properly in 2026
- 1-page report template
- From the report to the 2027 request
- Common mistakes in video reporting
- Frequently Asked Questions
- An honest report opens the conversation for 2027
To justify the 2027 video budget, put together on one page what each 2026 video needed to do, the number showing whether it did, and where that number is. Leadership approves a short report broken down by objective more easily than a list of views.
In this guide, we show the metric for each objective, where to find the number in each tool, and how to fill the gaps from a year when nobody measured properly. At the end, there is a one-page report template and the path to the 2027 request.
Quick summary:
- Group videos by objective before opening any dashboard.
- Each objective has a key number, and it is rarely views.
- The data is scattered: YouTube Studio, LinkedIn, GA4, Vimeo or Wistia, course platform, CRM, and a quick survey with the team.
- Where there was no measurement, use an estimate showing the math and feedback from those who used the video, without rounding up.
- The report fits on a one-page table and ends with three decisions: continue, update, or stop.
What leadership wants to know
Those who approve budgets ask few questions, all about usage and impact. Was the video seen by those who needed to see it, did it change any behavior, did it save time or money?
Finance adds another: how much each thing cost. The report needs to show, side by side, the investment in each video or package and the measured result, even when the result is qualitative.
Total views serve as context. A training video with 300 views may have met 100% of the goal if the company had 300 people to train.
Metrics by video goal
Start by separating the year's videos by the job each one had to do. The table below shows the question leadership asks for each objective and the number that answers it.
| Goal | Question from leadership | Primary metric | Supporting metrics |
|---|---|---|---|
| Mark | Did the right audience watch and stay until the end? | watch time and average retention | views by target audience, followers gained, brand searches |
| Sales and case studies | Did the video help close deals? | deals that received the video and how many closed | use in proposals, sales team feedback, who watched (Wistia) |
| Website and conversion | Does the page with video convert better? | page conversion rate | video starts and completions, time on page |
| Training and e-learning | Did people finish and learn? | completion rate and assessment score | instructor hours saved, repeated questions, course rating |
| Onboarding | Does the new hire get up to speed faster? | track completion before day one on the job | time to autonomy, questions to HR and managers |
| Events | Did the event content keep working afterward? | views of the recording and clips after the event | attendance, use of videos by sales, satisfaction survey |
Sometimes a video has two goals, like a brand video that is also included in proposals. Choose the primary goal for the report and mention the other as an additional use.
Where to find each number
The numbers for the year are scattered, and each tool counts views differently. The table shows the path in each one and what to export.
| Tool | Where to look | What to export |
|---|---|---|
| YouTube Studio | Analytics, in advanced mode, filtered from January 1 to today | views, watch time, average duration, retention, traffic sources |
| LinkedIn (company page) | Page analytics, content tab, and details for each video post | views, watch time, demographics of viewers |
| GA4 | Engagement reports: events and pages | video events, conversions on pages with video |
| Vimeo or Wistia | Stats for each video | who watched, how much they watched, where the video was played |
| Course platform (LMS) | Completion and assessment reports by course or cohort | enrolled, completed, grades, reaction evaluation |
| CRM | Deals of the year, filtered by those that received video | quantity, value, close rate |
| Internal survey | Short form for sales, HR, and managers | reported use, concrete examples, requests for 2027 |
YouTube Studio
In advanced analytics mode, you can list all the channel's videos for the period and export the table to a spreadsheet. Look at average view duration alongside video length: a 1-minute average on a 90-second video is very different from 1 minute on a 10-minute video.
Also check traffic source and playback location. A brand video embedded on your site appears under playback locations as embedded in external websites and apps, which helps separate viewers who came via YouTube from those who watched on your page.
LinkedIn's most useful data point for B2B is the viewer's profile: job title, industry, company size. In a meeting, saying that industrial procurement managers watched the video carries more weight than the total view count.
Export the data now, with time to review the year. For 2027, see the guide to LinkedIn video for businesses.
GA4
With enhanced measurement active, GA4 tracks starts, progress, and completions of YouTube videos embedded on the site. These events appear in the events report and can be cross-referenced with the pages where the video is hosted.
For conversion goals, compare the page's conversion rate before and after adding the video, or those who hit play versus those who didn't. Make sure to note in the report that this is correlation, since copy, ads, or offers on that same page might have changed during the period.
Vimeo and Wistia
Both show how much of each video was watched, and Wistia goes down to the individual level when the viewer is identified via forms or CRM integration. For case studies and demos, this is the data point that connects the video to a pipeline opportunity.
If you're still deciding where to host each video in 2027, the comparison is at corporate video hosting.
LMS, CRM, and internal surveys
The course platform holds the strongest numbers for your training report: enrolled, completed, and grades. Ask the administrator for a report by course and cohort, covering the 2026 period.
In the CRM, data relies on someone having logged that the video was sent. If no one logged it, the sales team survey fills the gap, as shown below.
Training, e-learning, and onboarding: completion, rating, and hours saved
Internal video is the easiest to justify because its impact shows up in working hours. The key metrics are how many completed it, how much they learned, and how much instructor time was saved.
| Number | How to calculate | Source |
|---|---|---|
| Completion rate | completions ÷ target audience for the course | LMS and HR list |
| Learning | average score on final assessment, or difference between pre-test and post-test | LMS |
| Instructor hours saved | in-person sessions eliminated × duration × number of presenters | HR or technical department calendar |
| Repeated questions | tickets or inquiries on the topic, before and after | HR, internal support, managers |
A hypothetical example of hours saved: a 3-hour in-person onboarding session, held across 12 cohorts a year with 2 presenters, consumes 72 staff hours. If video replaced two-thirds of that presentation, 48 hours were given back, and HR knows what that time is worth.
Use the right denominator for completion. Completions divided by enrolled hides those who never even started; divided by the total audience required to take the course, the percentage drops, but it accurately reflects reality.
Onboarding videos · view case study
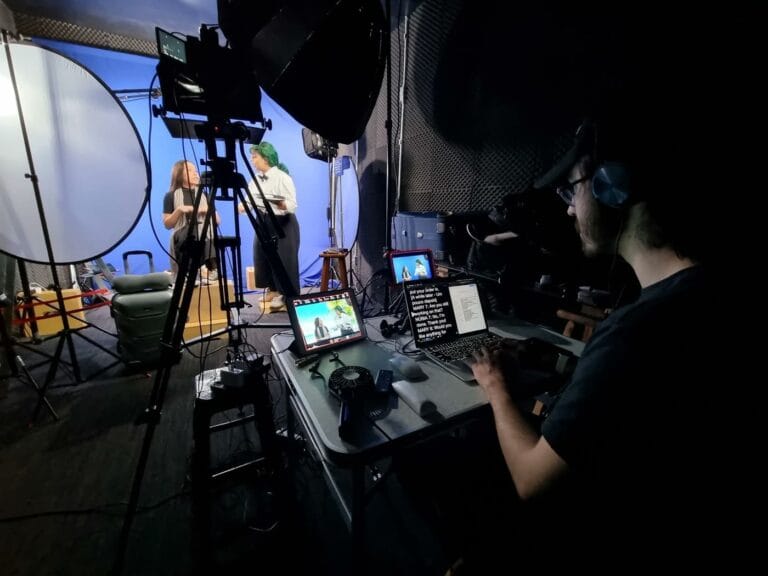
MILPLAN Engenharia turned its onboarding presentations into 10 videos to save time for the team that had to present the company policies with every new hire. In a project like this, saved hours go straight into the report.
Onboarding track · view case study
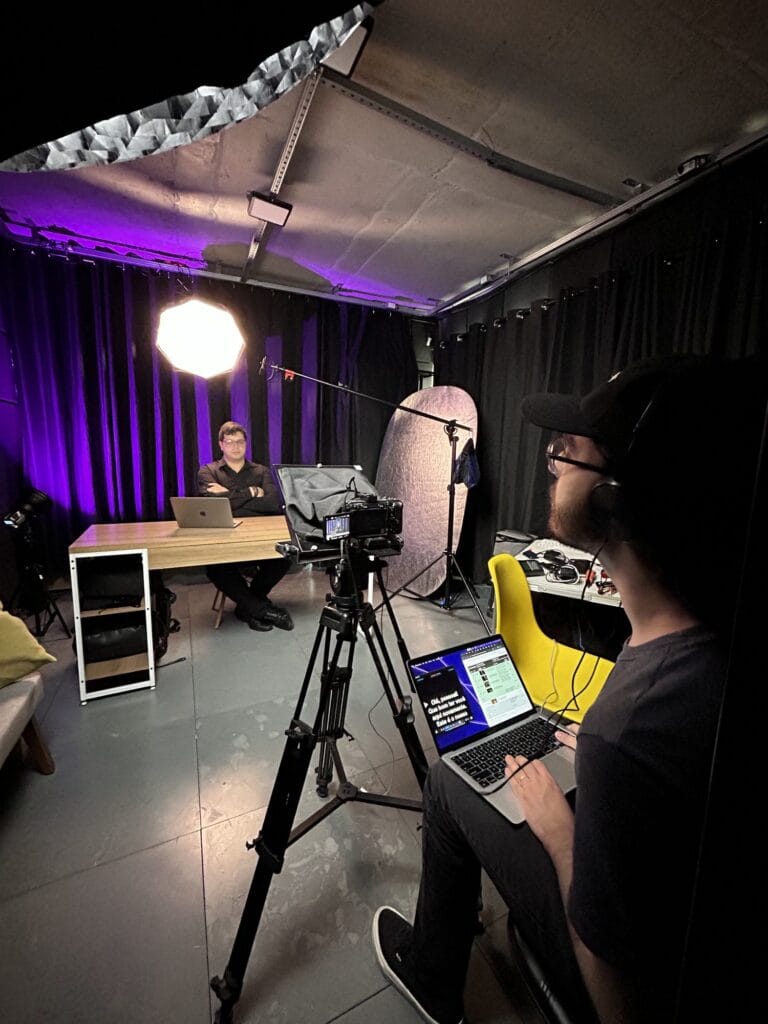
In the Bússola MRS track, featuring more than 30 videos across five collections, each collection wraps up with a recap and a reflective exercise. This structure creates measurement points within the platform. More about the format at video learning paths and in our training video production.
Sales and case studies: connecting the video to the CRM
Case study videos do their work in meetings, proposals, and emails, far from view dashboards, so their metrics live in the CRM: how many opportunities received the video and how many closed.
If the company closed few deals during the year, don't calculate a close rate on a small sample. List the deals where the video was used, along with the sales rep's account of its role in the conversation.
Case study video · view case study
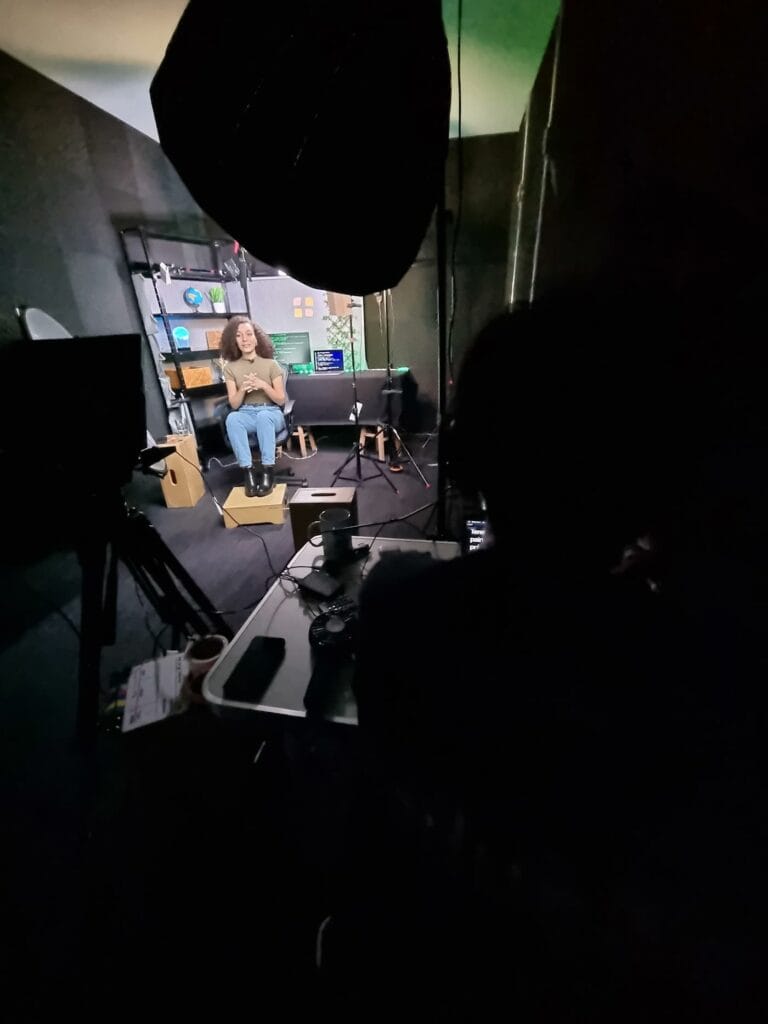
The TrueChange case study with MRS was built for sales reps to play instead of flipping through slides about the solution. In the report, the question is how many times the team used the video and at what stage. See when to send testimonial videos in the funnel and our case study video production.
For 2027, create a field in the CRM deal to check “video sent” and which video. The tweak takes five minutes and avoids digging through data at the end of 2027.
Brand and events: qualified reach and shelf life
Brand videos are measured by who watched and how long they paid attention. Show retention, watch time, and who watched, and compare it with the company's own history, without generic industry benchmarks.
Testimonial series · view case study
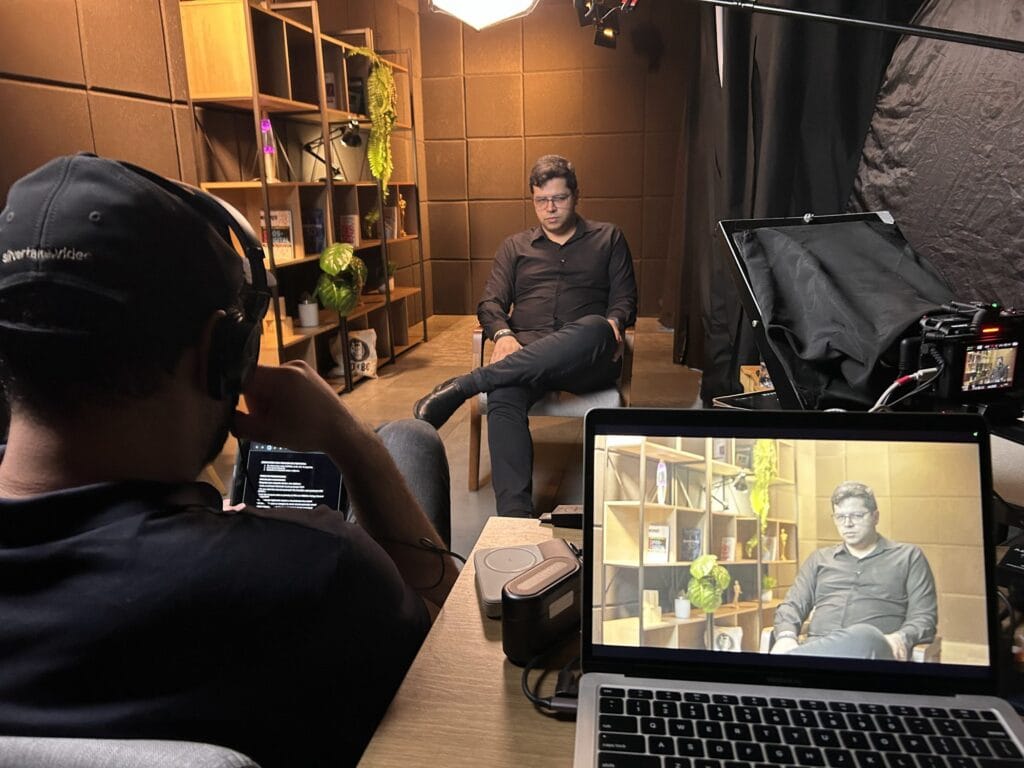
Imeri Capital published over 130 videos, including CEO testimonials and clips subtitled in Portuguese and English, on YouTube, LinkedIn, and their website. In a series this size, reporting works better by topic and channel than video by video.
For events, the most commonly missing metric is what happens afterward: how many people watched the recording and clips in the following weeks, and whether the sales team used any excerpts. For the next event, plan the clips beforehand, as we suggest in videos for sales conventions.
When nobody measured properly in 2026
It is common for the year to end with incomplete data: untracked links, case studies sent via WhatsApp, training sessions without reports. Even so, you can build an honest report, as long as every number comes with its source.
| Missing data | How to reconstruct | How to present |
|---|---|---|
| Case studies sent by sales | quick survey with each sales rep and searching email and CRM for the video link | “at least X proposals”, with the source |
| Hours saved in training | 2025 training schedule compared to 2026 | estimate with the math written out |
| Effect on the website | GA4 before and after the video was added to the page | observed variation, marked as correlation |
| Use in events and meetings | feedback from the organizer and managers | list of occasions, without made-up numbers |
The survey with sales can have three questions: which videos did you use, in roughly how many deals, and do you remember a conversation where it made a difference? The third yields the quotes that convince leadership.
Always use the lower number when in doubt. “At least 15 proposals” holds up to any question in a meeting; “around 30” falls apart at the first.
Also record what changes in the 2027 measurement. Leadership accepts an explained gap, as long as it doesn't return the following year.
1-page report template
The entire report fits in one table, with one row per video or package and three lines of text above it. Here is the template, filled with hypothetical sample rows to show the format.
| Video or package | Goal | Investment | Primary metric | Source | Decision for 2027 |
|---|---|---|---|---|---|
| Corporate | brand | project R$ | average retention and watch time | YouTube Studio, LinkedIn | continue, with a vertical version |
| 3 video cases | sales | package R$ | used in at least X proposals | CRM and sales team survey | produce 2 more, from another sector |
| Product explainer | website and conversion | project R$ | page conversion before and after | GA4 | update the system screen |
| Onboarding path | onboarding | project R$ | completion and instructor hours saved | LMS and HR calendar | include a new module |
| Clips from the annual event | events | package R$ | views after the event | LinkedIn and YouTube | stop: low usage |
Above the table, write three sentences: what worked best, what didn't work, and what changes in 2027. Below, a line with total investment for the year and the measurement gaps that will be fixed.
Approvers read the decision column first because it shows the report was used to make choices and already sets up the 2027 request.
From the report to the 2027 request
Each line marked as “continue” or “update” becomes an item in the following year's plan. Lines marked as “stop” free up budget, and that works in your favor in the meeting.
With the list in hand, build the plan in video planning for 2027 and calculate the cost in video budget for 2027. There you'll also find how to defend the budget in the meeting: each video presented with its goal, usage, and metric alongside it.
For external context, use numbers with verified sources, like those from 2026 video statistics.
In the global survey by Wyzowl 2026, 82% of marketers said video delivered a good return, compared to 93% the previous year. The answer for your leadership team, however, needs to come from your own numbers.
Common mistakes in video reporting
- Vanity metrics as the main result. Total views and likes serve as context; the primary number is the one that answers the video's objective. We explain why high reach doesn't pay the bills in The myth of the B2B viral video..
- Comparing brand videos with conversion videos. A brand video and a product explainer have different jobs. In the same click ranking, the brand video loses unfairly.
- Adding up views from different platforms. Each platform counts views differently, and the total becomes a meaningless number.
- Hiding what didn't work. A video marked as “stop” gives credibility to the rest.
- Presenting an estimate as measured data. Write out the calculation and the source.
- Measuring only the video and forgetting how it is used. If the case study sat unused in the marketing folder, the report needs to say so. See videos at each stage of the B2B funnel.
Frequently Asked Questions
Which metrics should be used to measure corporate video?
It depends on the objective. For brand, retention and watch time; for sales, usage in proposals and closed deals; for websites, page conversion; for training, completion rate, score, and instructor hours saved.
How to calculate the return of a training video?
Add up the in-person presentation hours that were eliminated, multiply by the presenter's hourly cost, and compare that to the investment in the video. Add the completion rate and evaluation score to show that the content reached people.
What to do if the company didn't measure anything in 2026?
Reconstruct whatever possible using internal surveys, CRM and email searches, and calendar comparisons. Present each number with its source, use the lower figure when in doubt, and include a measurement plan for 2027.
How many pages should a video results report have?
One, with the table broken down by video and three summary sentences. Detailed data, such as YouTube or LMS exports, goes in an appendix for anyone who wants to check.
Are views a bad metric?
It is useful for social media videos and for comparing pieces of the same type. As the primary metric for a sales or training video, it says little about what happened after play was pressed.
When to build the report?
Between November and early December, before the budget meeting. That allows enough time to export the year's data, talk to sales and HR, and arrive with the 2027 plan ready.
An honest report opens the conversation for 2027
With videos sorted by objective, each number pulled from the right tool, and gaps shown with transparent math, the budget request is easy to defend. The one-page table brings that into the meeting.
If you are wrapping up your report and want to plan next year's videos with measurement already factored in, Tell me what you need. and we'll build the proposal with you. To see training projects, case studies, and corporate videos, visit the portfolio.
Published on November 11, 2026

Samuel Silva is the co-founder and Creative Director of Silvertake Vídeo, a video production company in Belo Horizonte. He leads a team that combines creativity and technology, delivering over 7,000 videos for more than 100 companies. A graduate in Advertising from PUC Minas, Samuel specializes in marketing, creative automation, and audiovisual production.